There is a globe in your LLM
Gurnee & Tegmark (2023) trained linear probes to take an LLM’s internal activation on a landmark’s name (e.g. “The London Eye”), and predict the landmark’s longitude and latitude. The results look like this:[1]
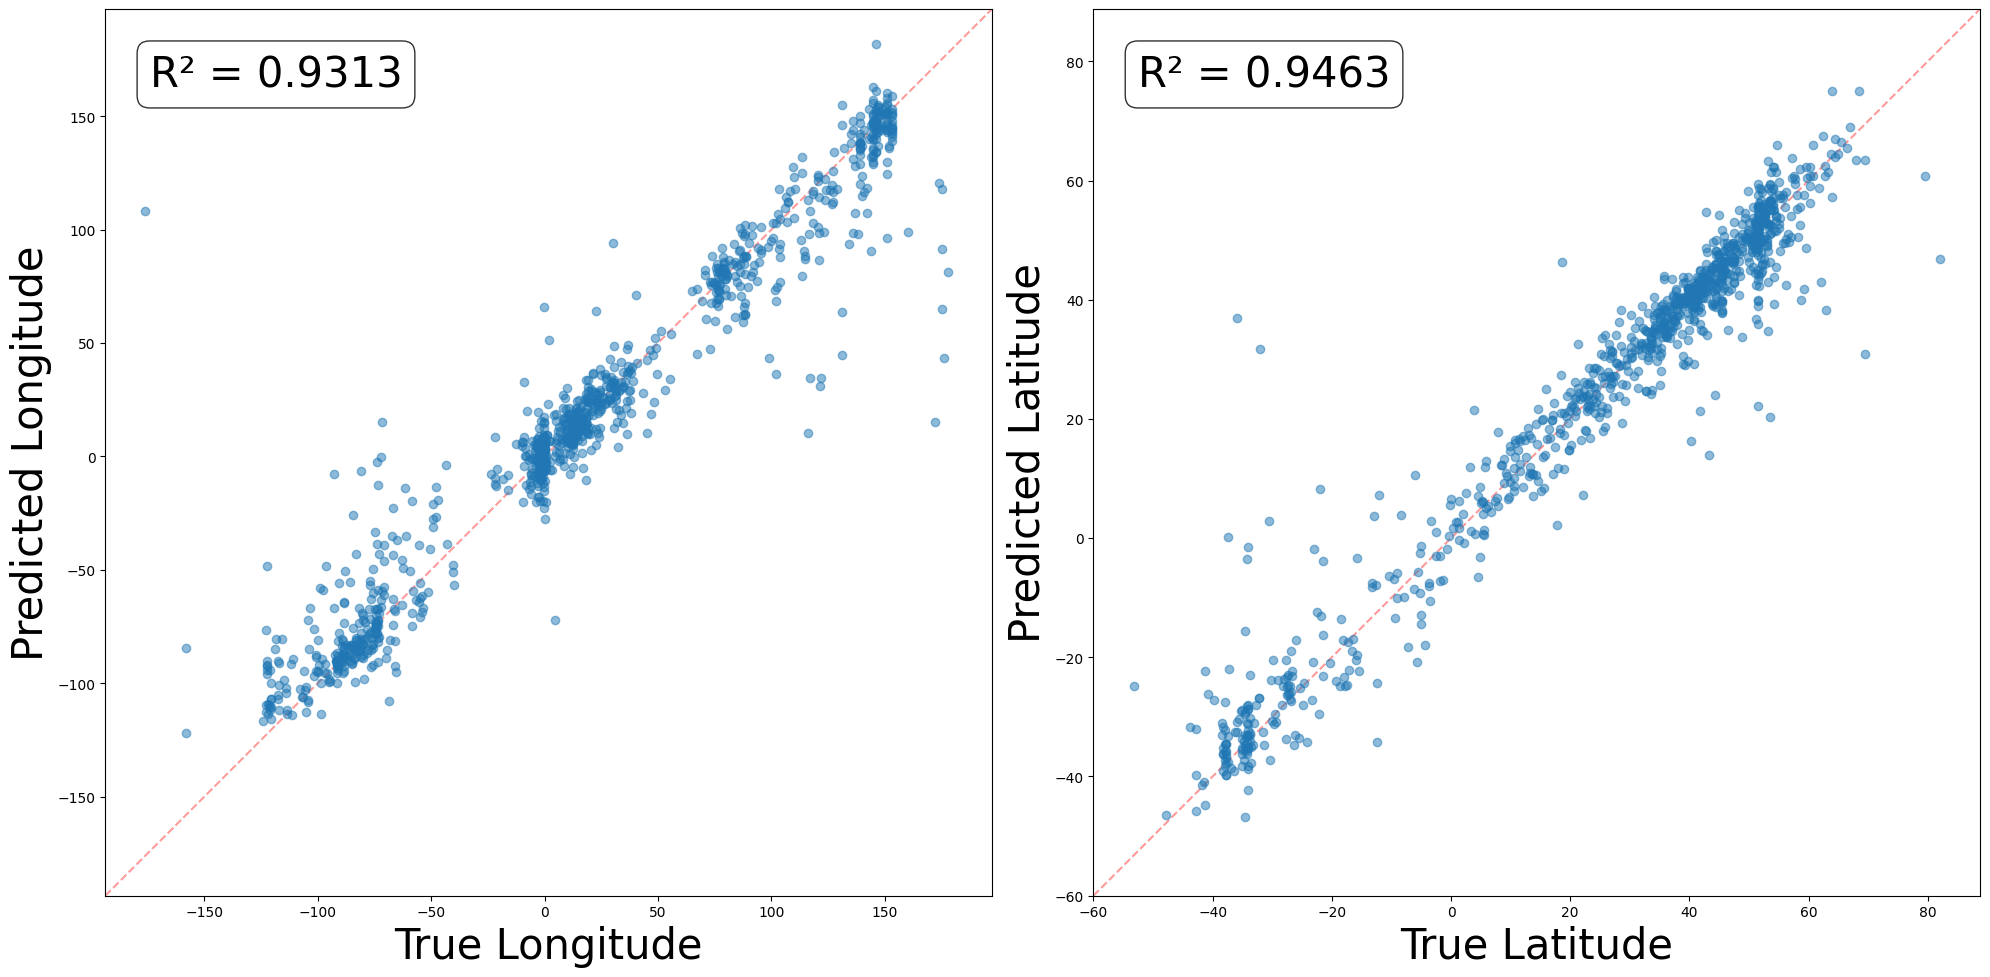
So LLMs (or at least, Llama 2, which they used for this experiment) contain a pretty good linear representation of an atlas.
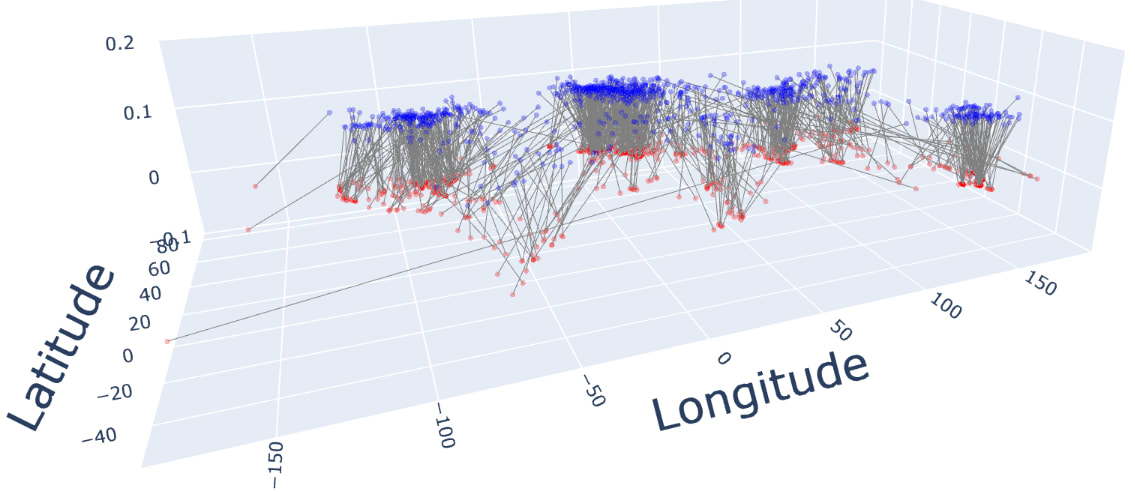
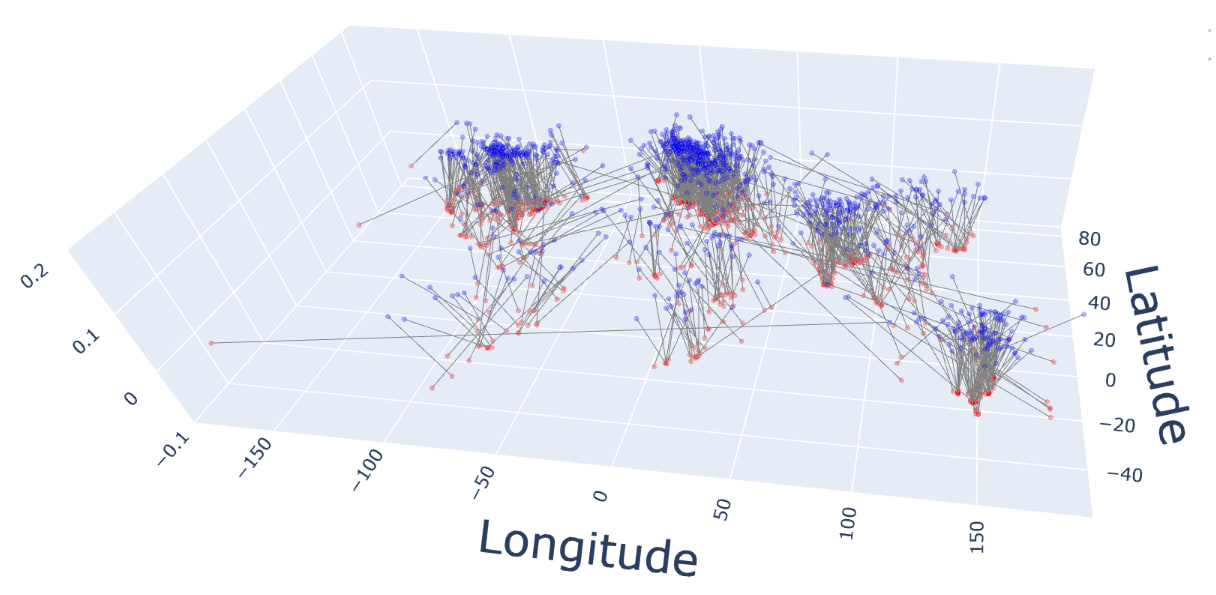
Sometimes, like when thinking about distances, a globe is more useful than an atlas. Do models use the globe representation? To find out, we can train probes to predict the (x,y,z) coordinates of landmarks, viewed as living in 3D space. Here are the results:
You can rotate the plot yourself (and see the code used to generate it) in this notebook.
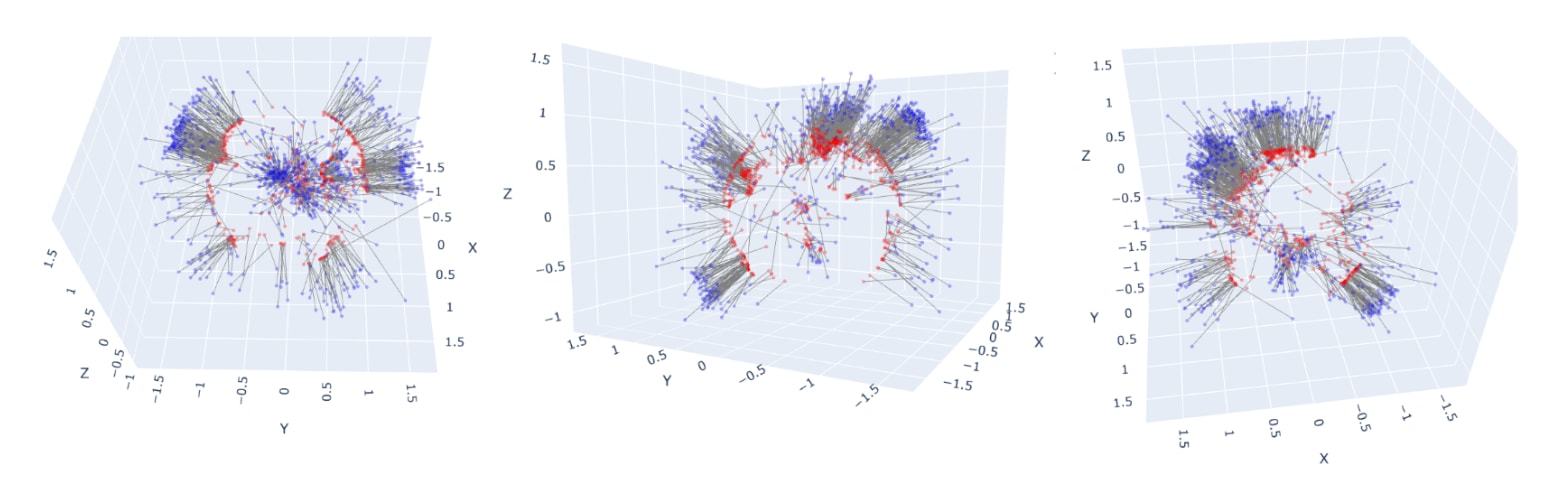
The average Euclidean (i.e. “through-the-Earth”) distance between the true and predicted locations is 535 miles: roughly the distance from Paris to Berlin, from LA to Portland, or from Mumbai to New Delhi.
So LLMs contain a pretty good linear representation of a globe!
I don’t know if there’s any useful takeaway from this. I just thought it was cool.
- ^
These plots are my reproduction. I used Llama-3-8B-Instruct, and Gurnee & Tegmark’s dataset. For ~7,000 of the 40,000 landmarks, the model did not correctly answer the question “which country is {place} in?”, so I removed these from the dataset. I fed landmark names into the model with no prefix, and cached final-token residual-stream activations 70% of the way through the model. All plots and values in this post were generated using a held-out 20% test split.
This is cool, although I suspect that you’d get something similar from even very simple models that aren’t necessarily “modelling the world” in any deep sense, simply due to first and second order statistical associations between nearby place names. See e.g. https://onlinelibrary.wiley.com/doi/pdfdirect/10.1111/j.1551-6709.2008.01003.x , https://escholarship.org/uc/item/2g6976kg .
Yes, people have been pulling this sort of semantic knowledge out of word embeddings since the start. Here is a long list from like 5 years ago, going far beyond just geographic locations: https://gwern.net/gpt-2#fn11
This is one of the reasons that people have rejected the claims that LLMs are doing anything special: because after all, just a word2vec, which barely even counts as a neural net, or n-grams, seems able to ‘learn’ a lot of the same things as a LLM does, even though it’s “obviously” not a world model. (It’s a modus ponens/tollens thing.)
One of the coolest demonstrations of extracting world models (and demonstrating the flaws in the learned world models due to a lack of inductive priors) is a paper on inferring the exact street connectivity & geography of New York City from training on taxi cab trajectories: https://x.com/keyonV/status/1803838591371555252 https://arxiv.org/abs/2406.03689
This is fascinating, and is further evidence to me that LLMs contain models of reality.
I get frustrated with people who say LLMs “just” predict the next token, or they are simply copying and pasting bits of text from their training data. This argument skips over the fact that in order to accurately predict the next token, it’s necessary to compress the data in the training set down to something which looks a lot like a mostly accurate model of the world. In other words, if you have a large set of data entangled with reality, then the simplest model which predicts that data looks like reality.
This model of reality can be used to infer things which aren’t explicitly in the training data—like distances between places which aren’t mentioned together in the training data.
A Turing machine just predicts (with 100% accuracy) the symbol it will write, its next state, and its next position. And that happens to be enough for many interesting things.