TLDR: Things seem bad. But chart-wielding optimists keep telling us that things are better than they’ve ever been. What gives? Hypothesis: the point of conversation is to solve problems, so public discourse will focus on the problems—making us all think that things are worse than they are. A computational model predicts both this dynamic, and that social media makes it worse.
Are things bad? Most people think so.
Over the last 25 years, satisfaction with how things are going in the US has tanked, while economic sentiment is as bad as it’s been since the Great Recession:

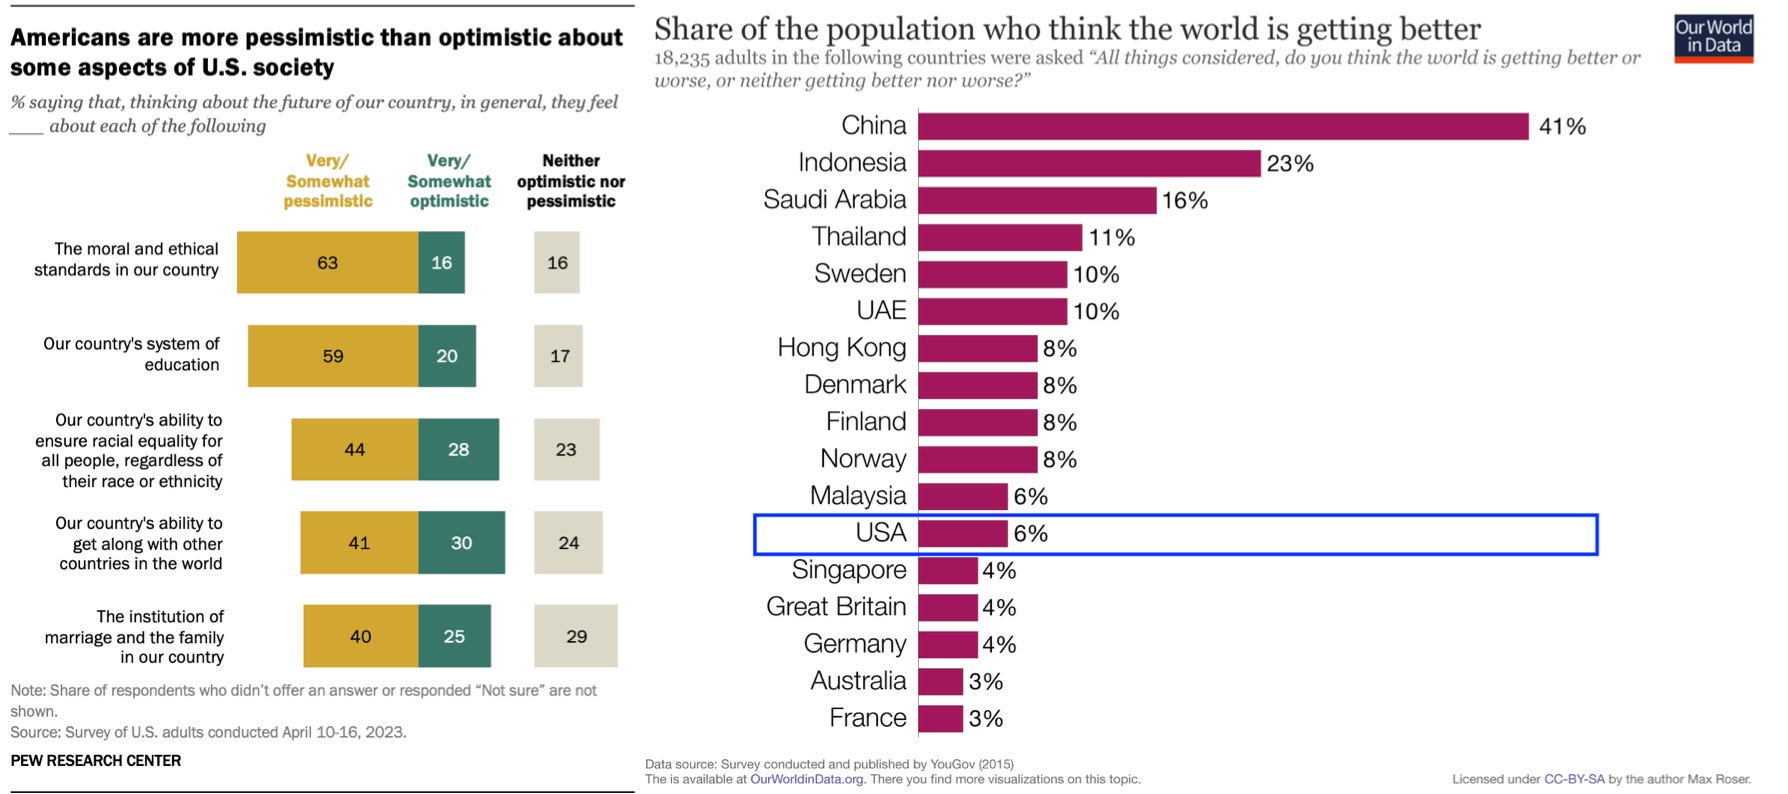
Meanwhile, majorities or pluralities in the US are pessimistic about the state of social norms, education, racial disparities, etc. And when asked about the wider world—even in the heady days of 2015—a only 6% of US respondents agreed that the world was “getting better”; 94% said “neutral” or “worse”.
So: the vibes are bad.
Well, are the vibes right? It’s unclear. There’s a chorus of chart-wielding optimists who repeatedly tell us they’re not. Instead, they say that on most of the ways we can measure, things are better than they’ve ever been. Here’s Barack Obama:
“If you had to choose one moment in history in which to be born, and you didn’t know in advance whether you were going to be male or female, which country you were going to be from, what your status was, you’d choose right now.”
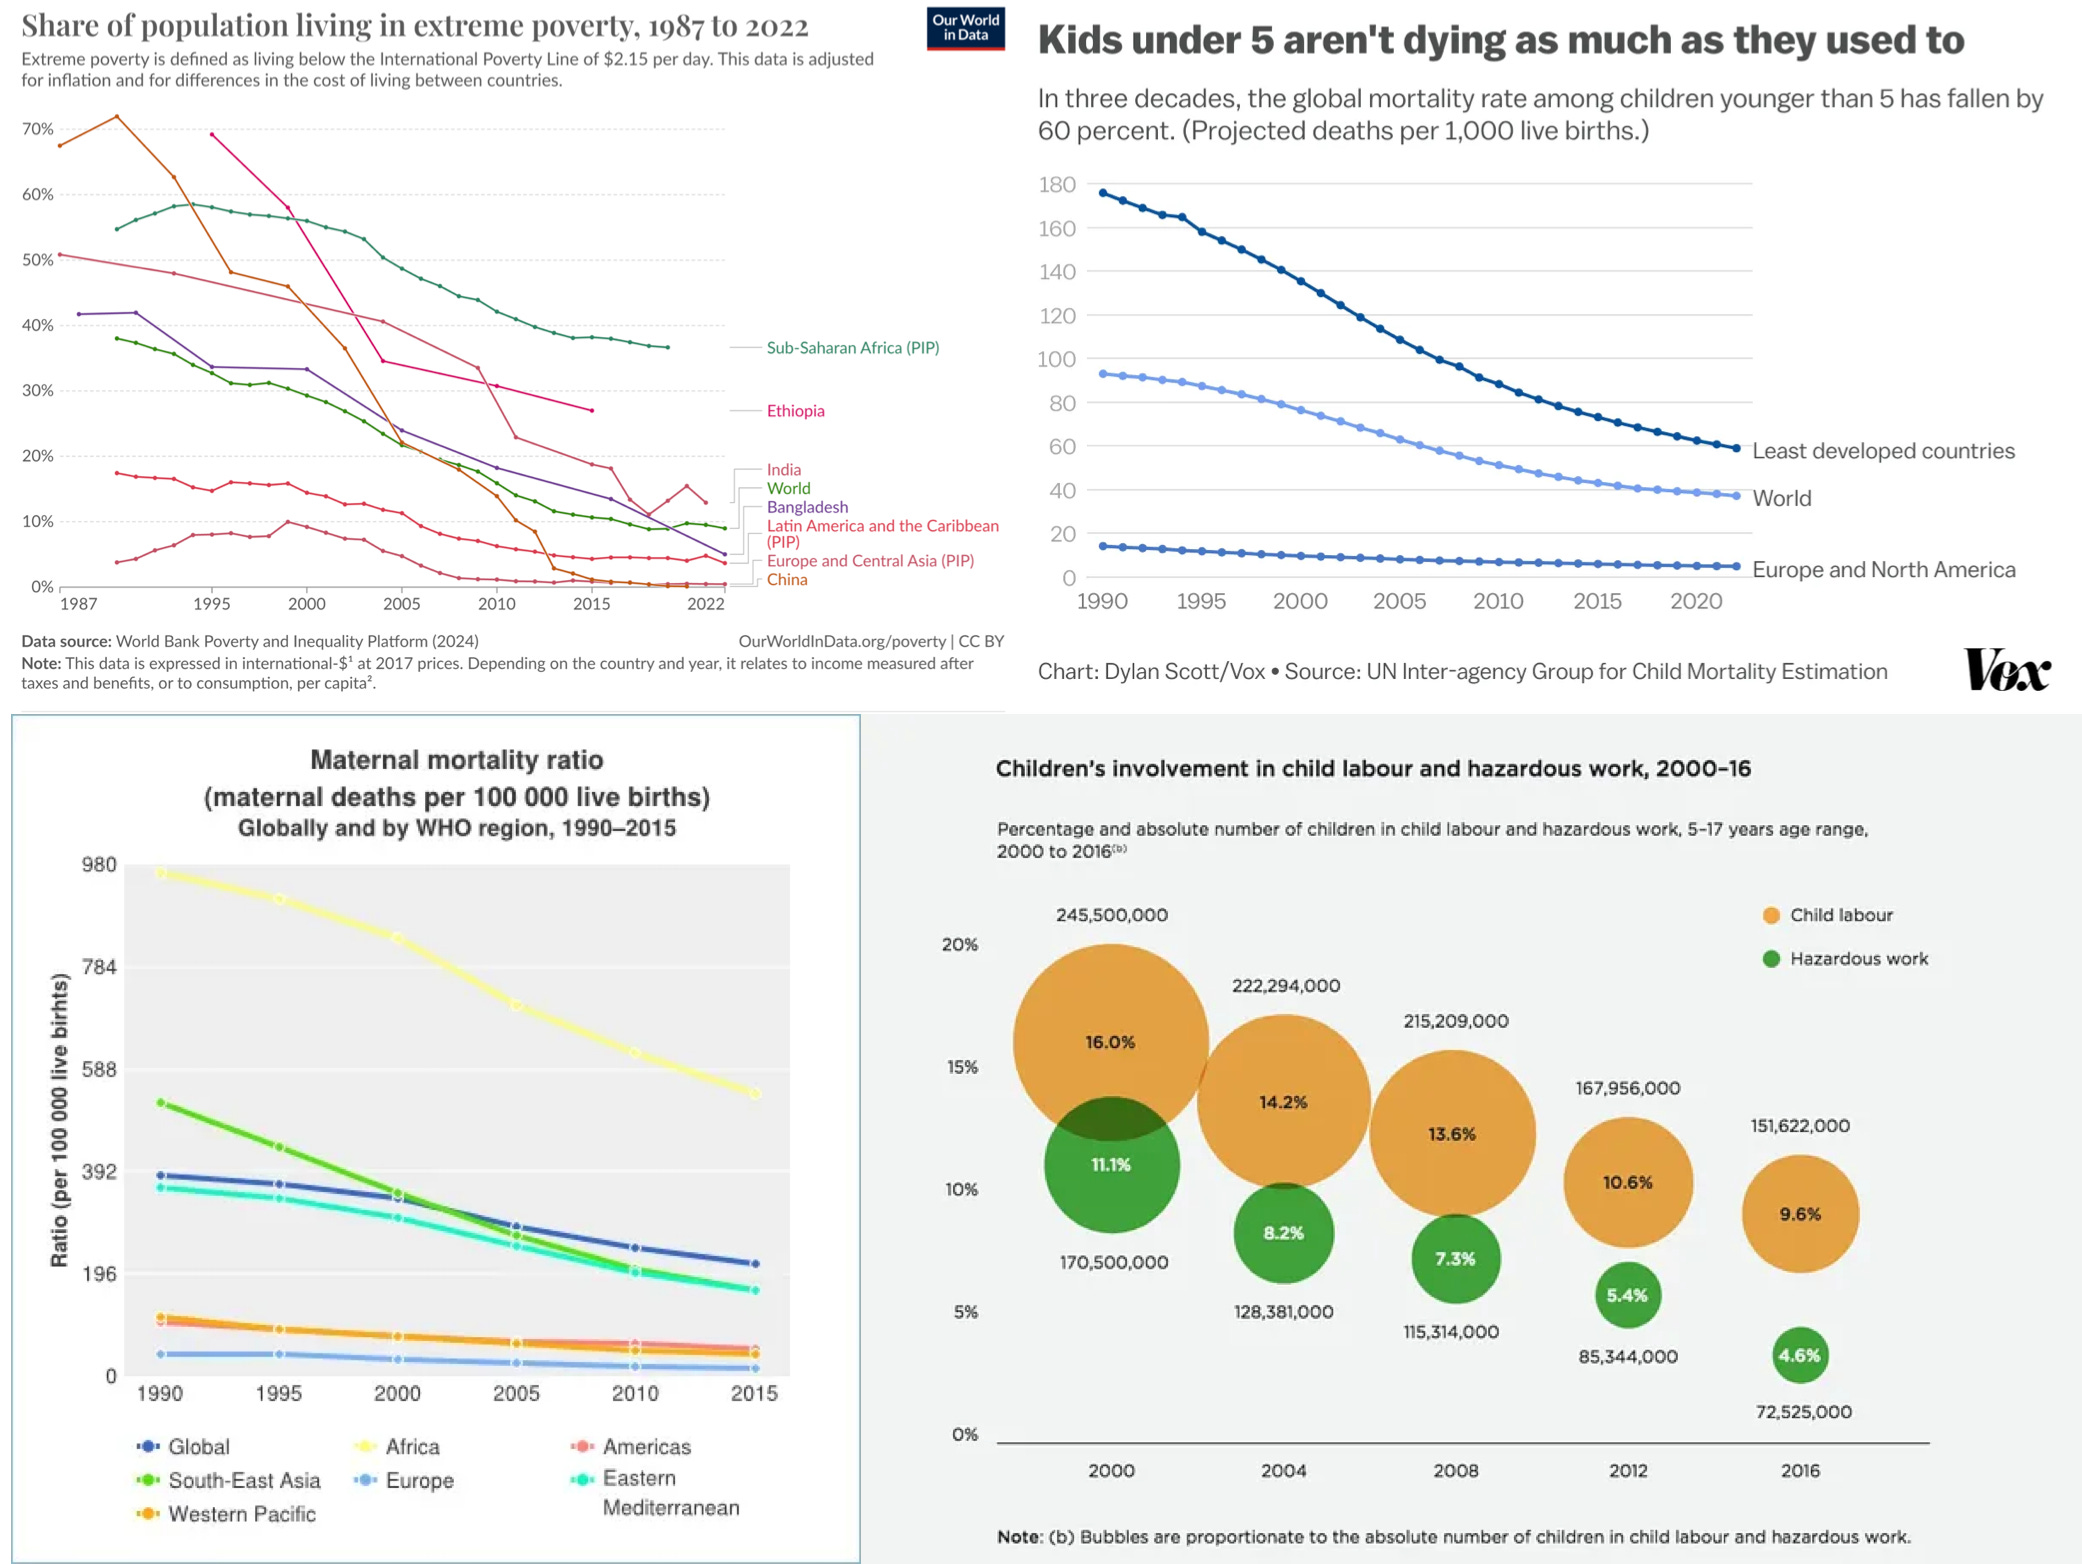
The easiest way to make this case is with worldwide trends. Over the last 40 years (not to mention the last 200), global rates of extreme poverty, child mortality, maternal mortality, and child labor (and I could go on) have all fallen:
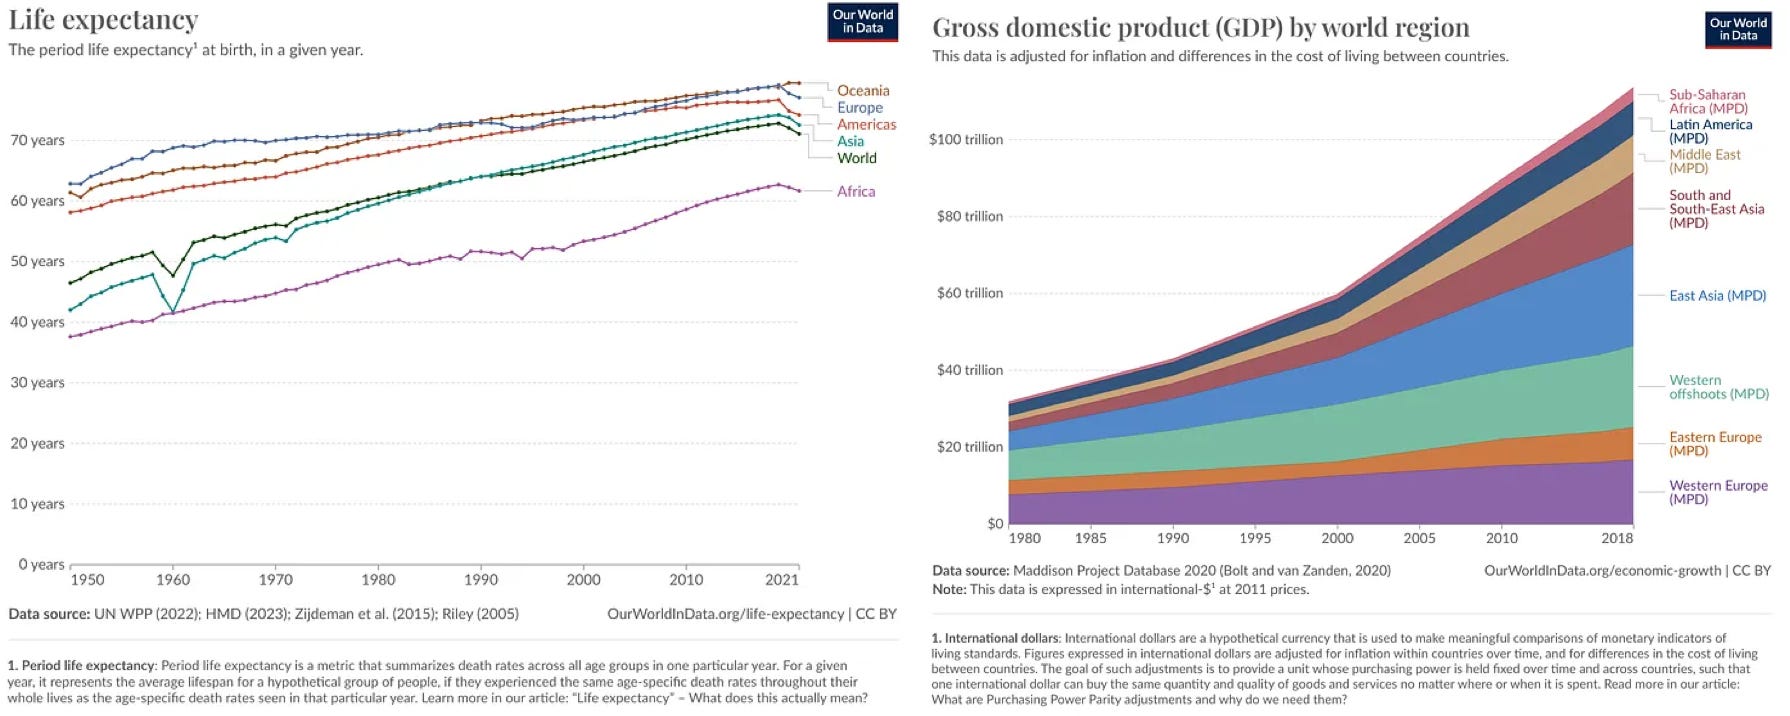
Meanwhile, life expectancy and GDP have risen:
Okay. But what about things in the US?
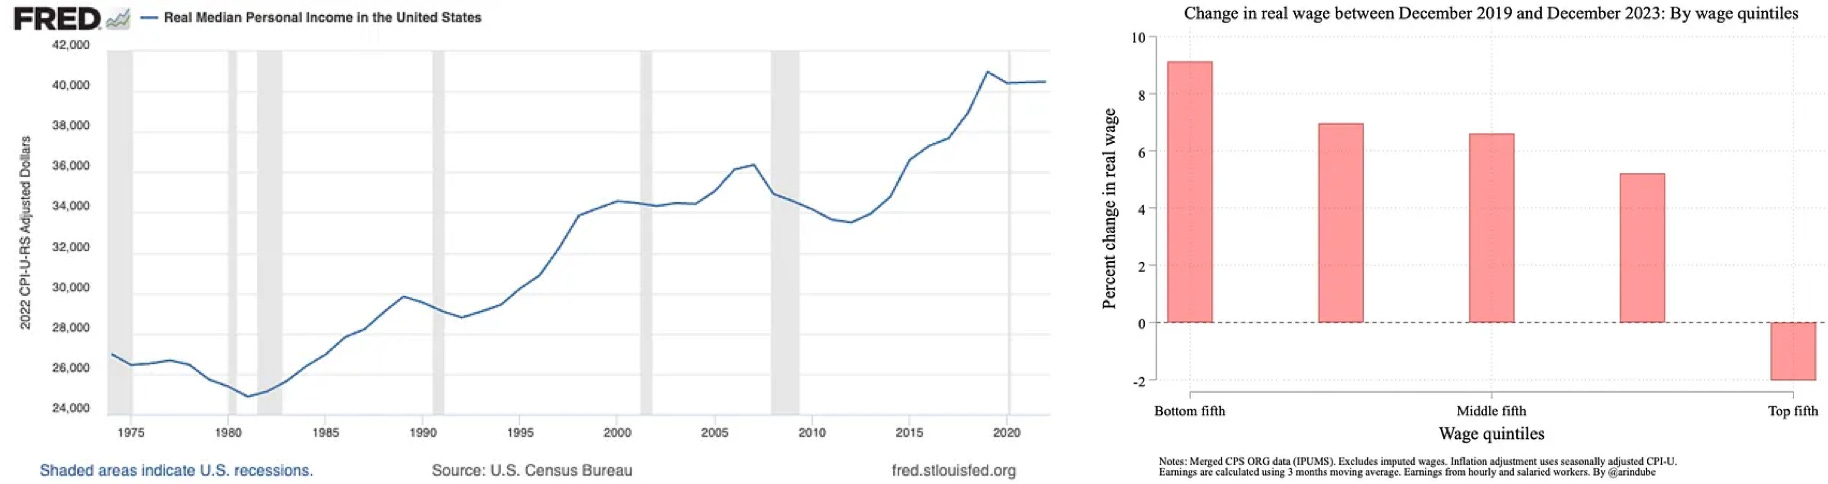
The chart-wielding optimists point out that—despite the recent “vibesession”—(inflation-adjusted) median wages are up, income inequality is down, and we seem to have achieved a “soft landing”.
Indeed, the chart-wielding optimists have charts that directly address the gap between the vibes and (their measures of) reality. They cite an “optimism gap”: for decades, people have tended to say that things are going well for them personally, even as they become increasingly pessimistic about their nation and the world.
For example, if we overlay the above chart showing people’s satisfaction with how things are going in the US as a whole against how things are going for them personally, we see that 4 times (78% vs. 20%) as many people are satisfied with their personal situation as with the national one:
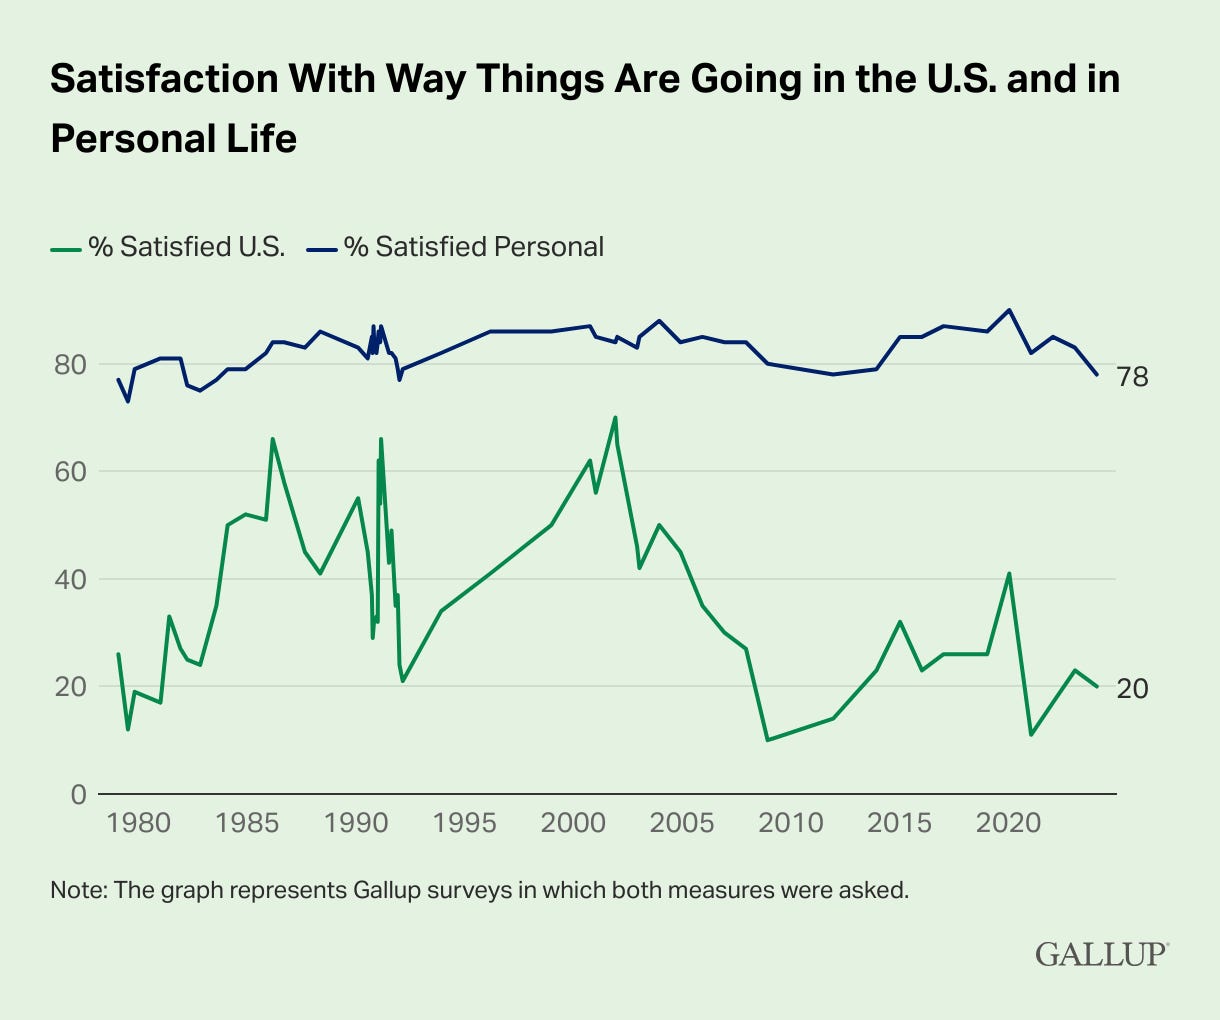
Of course, this might just be due to inequality. Could it be that most people are aware that things are going badly for 22% of people, and that’s enough to make them think things are going badly in the nation?
Maybe. But there’s also direct evidence that people over-estimate how badly things are going for their compatriots.
In 2017, people were asked both (1) whether or not they were happy, and (2) to estimate what proportion of their compatriots would say that they were happy. If their estimates were accurate, then plotting average self-reported happiness (x-axis) against average estimate of happiness (y-axis) would produce a diagonal line.
Instead, in every country studied the average estimate was way below the average happiness. People report being quite happy on average (the data are on the right of the chart), but their estimates for how happy most people are are quite low (the data on the bottom half of the chart).
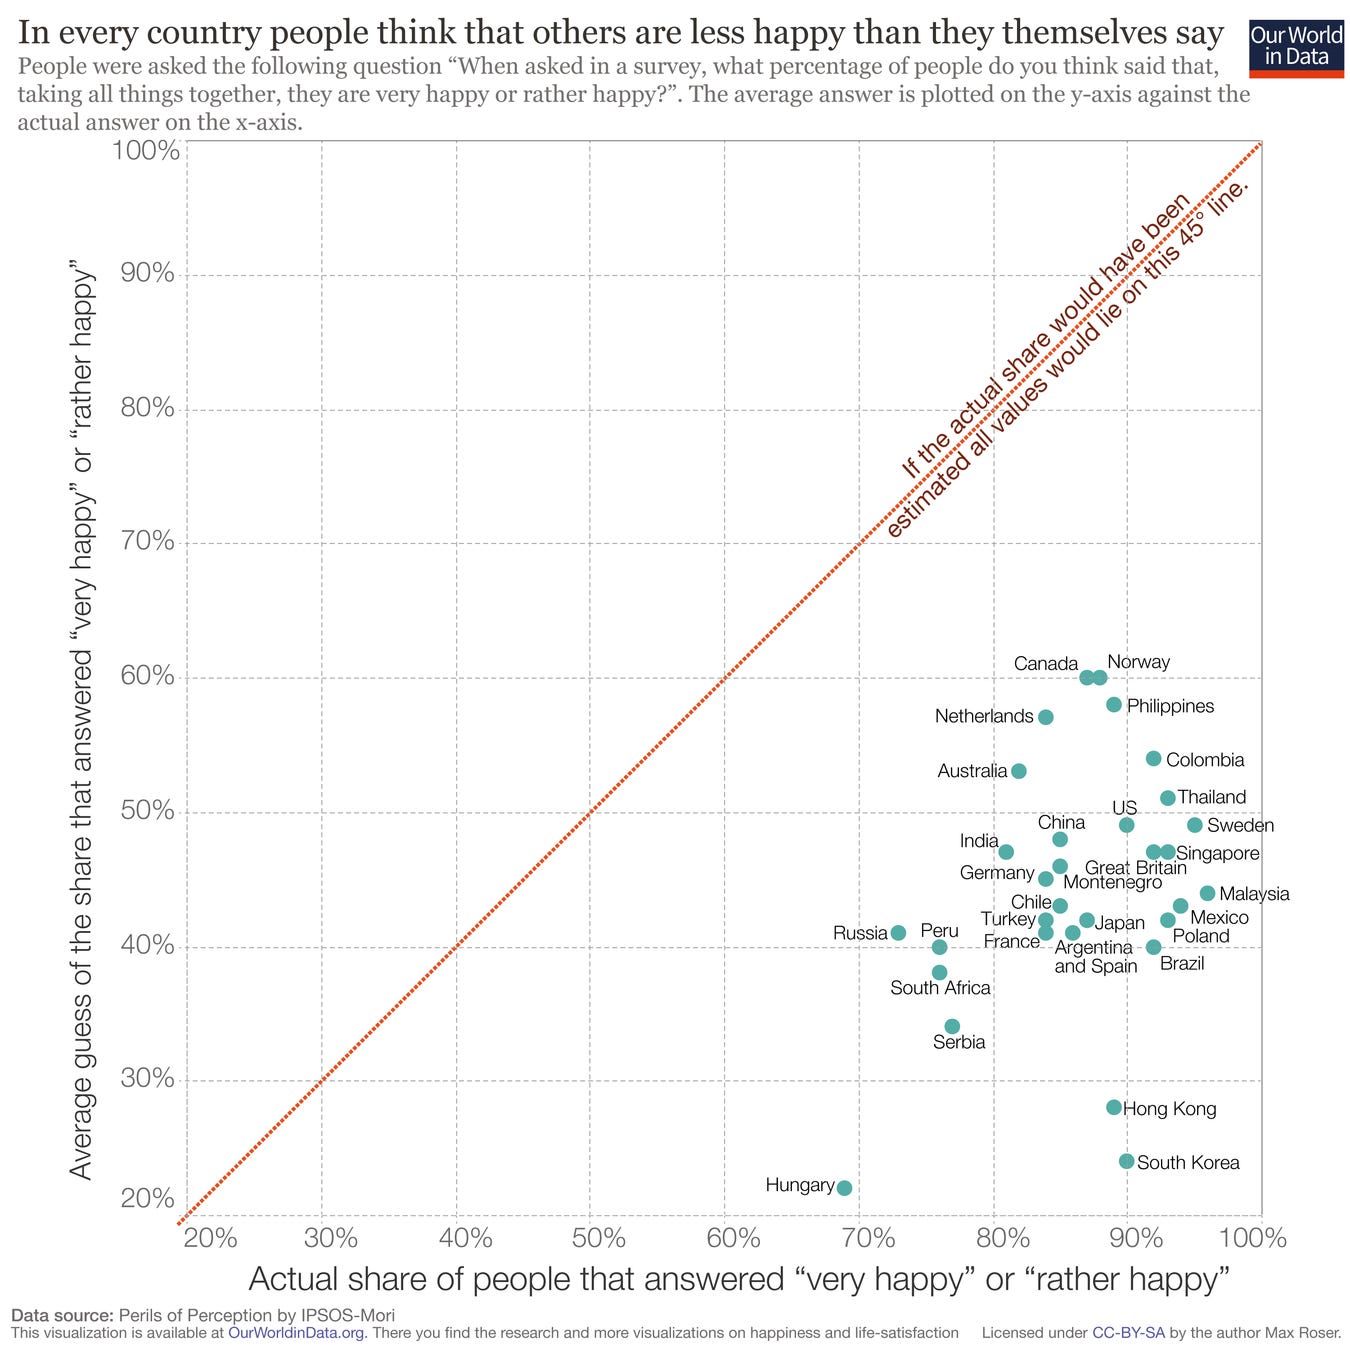
To put a fine point on it: the average estimate for happiness in the the most-optimistic country (Norway) was 60%, while the rate of happiness in the least-happy country (Hungary) was 69%. People really do under-estimate how happy others are.
Who’s right?
So who’s right—the down-to-earth pessimists, or the chart-wielding optimists? And regardless, what explains the optimism gap?
Intuition (and vibes) probably make you suspicious of the optimists. If things are really so great, how could we all have missed it? Either their charts are missing something, or we’re all being horribly biased and benighted in our outlooks. Right?
Wrong. There’s a natural explanation for why we’d rationally be overly pessimistic—i.e. why we’d tend to over-estimate how bad things actually are.
Start with an anecdote. Recently I had dinner with two close friends—Andrew and Luke. It’d been a few months, and we had a lot to catch up on. Both were in new relationships. Two things quickly became clear: Andrew’s was going well; Luke’s was not.
Take a guess: which relationship did we spend more time talking about?
Luke’s, obviously. This is familiar: good relationships usually generate short and sweet conversations—there’s not that much to talk about. Bad relationships can generate endless conversation—there’s so much to complain about, troubleshoot, and plan around.
This generalizes. Conversation topics are not random samples of the days’ events. The point of (many) conversations is to solve problems. So it makes sense to spend more time and energy talking about problems (bad news) than positives (good news).
Upshot: even when most of the news is good, we should expect conversation topics to be disproportionately negative.
Hypothesis: maybe this explains the optimism gap. Maybe an orientation toward problem-solving leads people to (rationally!) talk more about problems, which in turns leads them to (rationally!) over-estimate how many problems there are.
I’m going to build a simple agent-based model of this, showing how:
Part 1 (this post): as the number of possible conversation topics increases—for example, with the rise of the information age—excess pessimism should increase.
Part 2 (next post): when these dynamics are embedded within a social network—for example, with the rise of social media—excess pessimism will get even starker.
The model
Imagine a simple world. Some number of things (“news items”) happen every day. Each news item falls into one of two categories—a problem or a positive.
Positives are good: Aydin got his dream job; Gini—a happy, healthy baby—was born to two loving parents; and so on.
Problems are bad: heartbreak, illness, death, and all that.
Suppose our simple world is great: 90% of the news items are positives; only 10% are problems.
Also suppose that every day, each person gets a random sample of the news. Every afternoon, they meet up with their friends and choose one topic to share to the group.
How do they choose what to share?
Start simple. Suppose everyone is an annoyingly-unfun do-gooder. No gossip or complaining or humble-bragging. Their only goal in conversation is to make things better—to spread good news that’s helpful, and to solve problems when it’s possible.
Different news items have different expected values for being shared—think of this as how likely it is that a benefit (like a solution) will come from talking about the topic. There’ll obviously be lots of variance—talking about your new socks is unlikely to make anyone’s day; talking about the new coffee shop just might.
I’ll assume that each topic has a random probability of leading to a benefit if shared (probabilities drawn from a beta distribution).
Key assumption: on average, problems are more likely to yield a benefit if shared than positives. For example, here are the distributions of benefit-probabilities when—on average—problems are 20% more likely to yield a benefit:
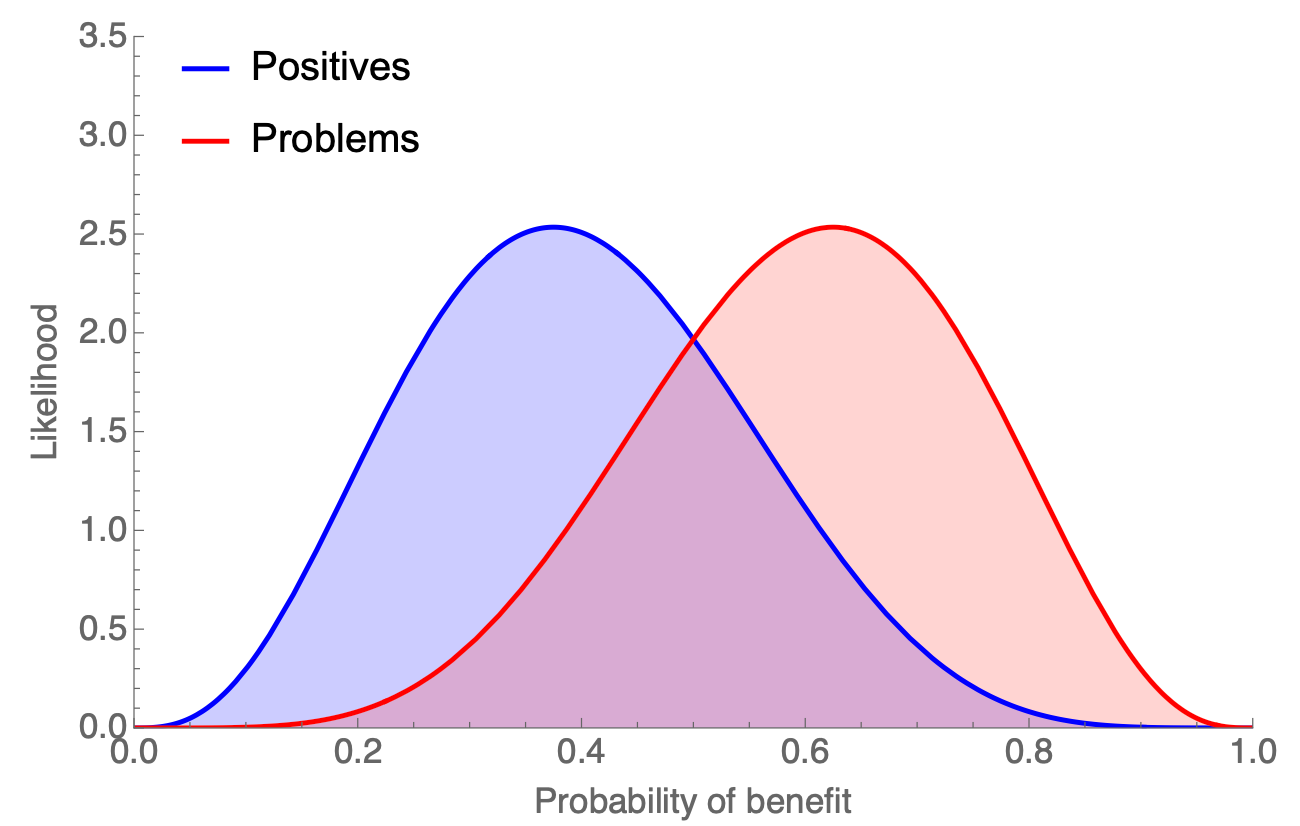
What this says is that (1) the mean positive has around a 40%-probability of yielding a benefit (peak of blue curve), (2) the mean problem has around a 60%-probability of yielding a benefit (peak of red curve), and (3) there’s quite a bit of variance around those means.
This captures the intuition above that problems are more likely to have solutions—we might be able to help Luke with his relationship—so are more often worth talking about.
How does conversation proceed? Each person has n topics to choose from. Our unfun do-gooders always select the one that’s most likely to yield a benefit. Since problems tend to be more likely to yield a benefit, this tends to skew the conversation toward problems over positives.
We can simulate what happens. We’ll vary both how much more likely (on average) problems are to yield benefits than positives (different-colored lines), and also vary how many topics (number of options, x-axis) each person has to choose from. Here’s what we get:
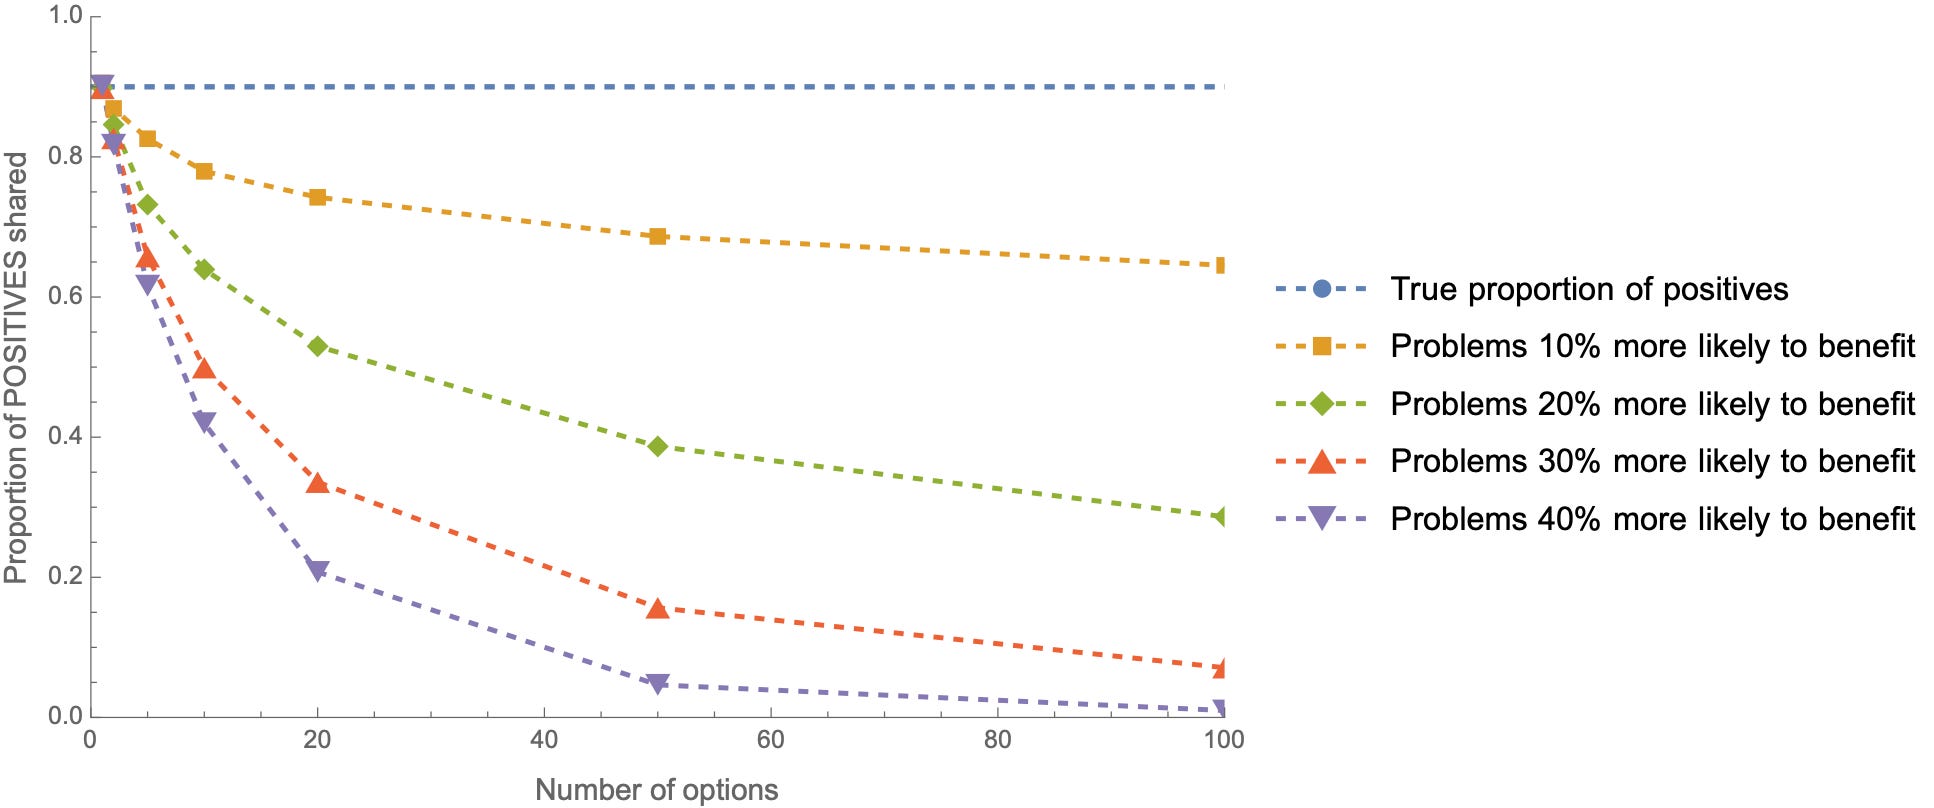
What’s this say? Look at the green line: if problems are 20% more likely to yield benefits, and each person has 50 topics to choose from (middle of the chart), the proportion of positive conversations—in a world where 90% of the news is good—is only 40%.
That means that if you assumed conversation-topics were representative of how good the world is, you’d think the world was less than half as good as it actually is (40% positive, rather than 90%).
Three observations:
The proportion of positives shared is always below the true proportion—an orientation toward problem-solving leads to bad vibes
Modest gaps in how much more likely problems are to be worth talking about can lead to a drastic over-representation of problems in public discourse.
As the number of conversation-topics grows, the gap increases: as people have more topics to choose from, it’s more likely that the most-worthwhile problem will be more worth-talking about than the most-worthwhile positive.
This final point makes the prediction that as people have more topics to choose from, the negativity of public discourse will increase—even if the rate of positive news stays at a constant (high value). So pessimism should grow with the rise of the information age—for example, when (inter)nationalized TV stations have more stories to choose from, they’ll more often be more negative.
Robustness
Of course, this model is simplistic. For instance, people have many goals in conversations—solving problems is only one of them.
Still, I think it highlights a pressure toward negativity that should remain in more realistic models of conversation.
To add a hint of realism, we can allow that people aren’t simply unfun do-gooders. Instead of always choosing the option that they expect will be most worth talking about, maybe they instead choose a topic via “softmax”: they are more likely to choose topics that are worth talking about, but noise or other factors can lead them to choose otherwise.
Softmax depends on a “precision” parameter, which says how much their choices are guided by the ranking of expected values. As precision goes to 0, they choose randomly; as it gets larger, they look more like expected-value-maximizers.
For example, suppose there are two options—A and B. A always has expected-value 0.5; now consider how likely they are to choose option B, as we vary its expected value between 0 and 1 and also vary the precision with which they do softmax:
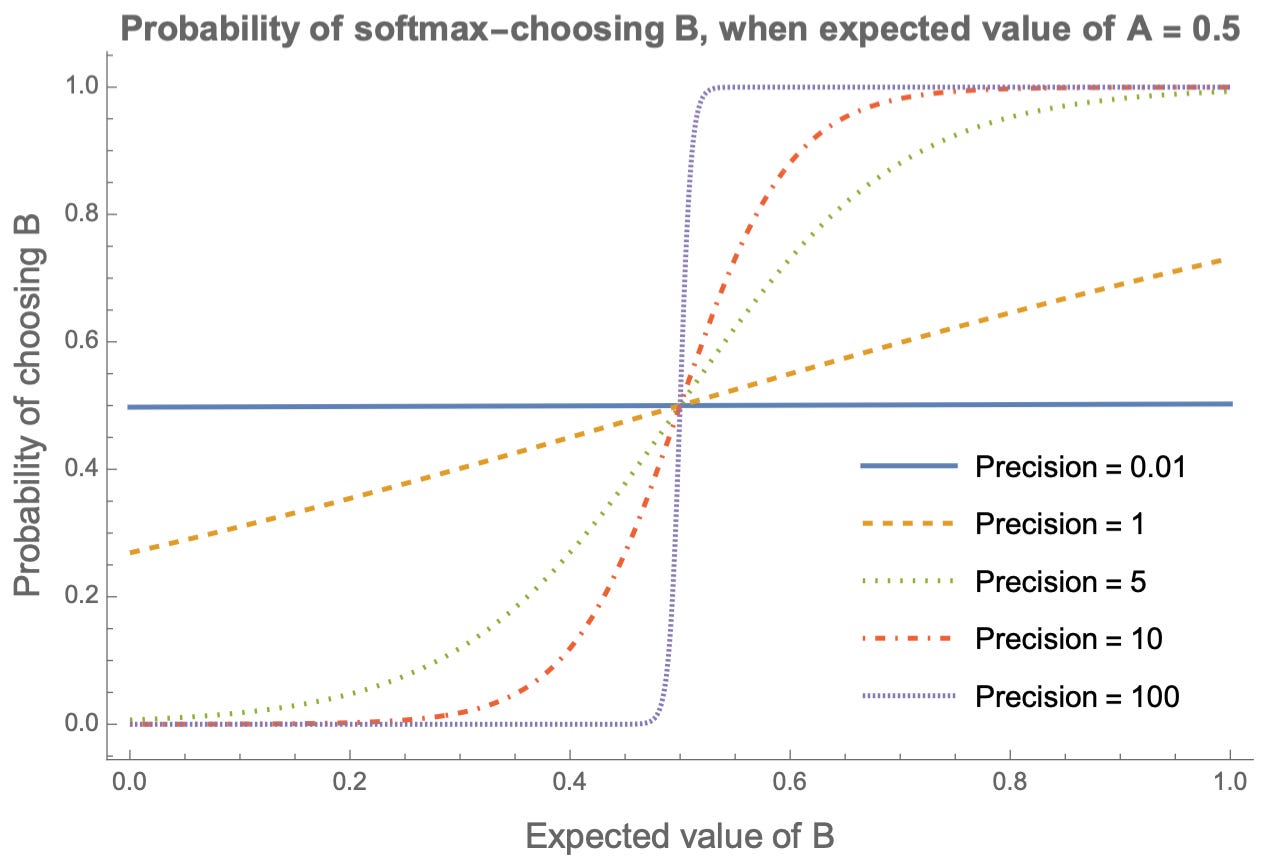
When precision is almost 0 (blue line), they are always 50%-likely to choose B—they randomize. When it’s 10 (red line), their choice probabilities form an S-curve; when it’s 100 (purple line), they form a step function—(almost) always choosing the option with higher expected value.
If we run the same simulations as above using softmax—so expected-benefit is just one determinant of conversation topics—we get qualitatively similar results. Here are the proportions of positives shared with a softmax precision of 10:
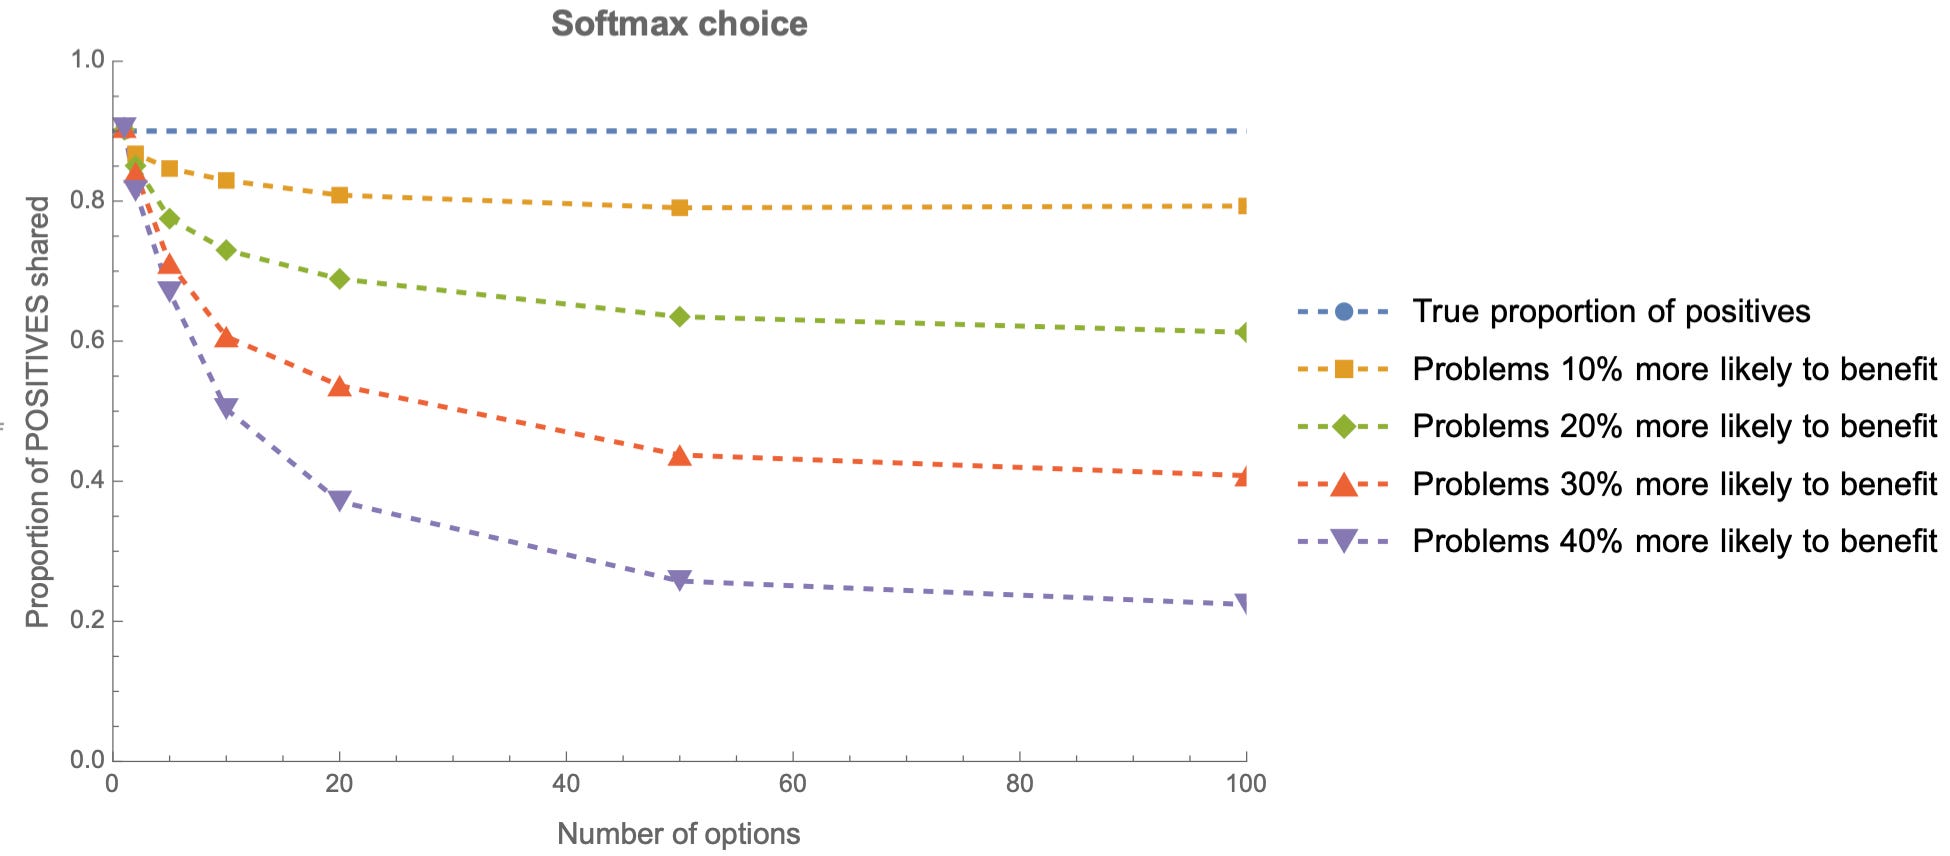
For example, look at the green line: if each person has 50 topics and problems are 20%-more-likely to be worth talking about than positives, then when 90% of news is positive only 65% of conversation-topics are positive.
Upshot
A problem-solving orientation in conversation may inadvertently lead to problems being massively over-represented in public discourse.
That might, overall, be a good thing! It’s good when people spread the word about problems, so that collectively we’re more likely to come to solutions.
But an unfortunate side-effect is excess pessimism: insofar as the vibes reflect the valence of the topics in public discourse, we should expect bad vibes even when things are quite good.
To some extent, I think this fact supports the chart-wielding-optimists’ case: we have the start of an explanation for why we’d all think things were worse than they are.
But just the start. Just because 40% of conversation topics are good doesn’t mean that the average person will infer that 40% of news is good. People are (implicitly) aware that conversations topics suffer from “selection effects”—few conversations are about shampoo—but that doesn’t lead people to assume that others rarely use shampoo.
So our question: (1) when we explicitly model people’s beliefs about how good things are, will these dynamics lead to excessively pessimistic beliefs? And (2) what happens when we embed these processes in a social-media network?
The next post will argue (1) yes, pessimism will result; and (2) that social media should make everything much worse.
This all makes sense of the purpose of life is to solve problems. It’s not. Being rational means maximizing your own goals. Usually people care more about some sort of happiness than solving the maximum number of problems. Spendingost of your time thinking about problems that you probably can’t solve anyway tends to make people unhappy. So it’s irrational by the goals of humans, even though it’s roughly rational by the goals of evolution.
Agreed that people have lots of goals that don’t fit in this model. It’s definitely a simplified model. But I’d argue that ONE of (most) people’s goals to solve problems; and I do think, broadly speaking, it is an important function (evolutionarily and currently) for conversation. So I still think this model gets at an interesting dynamic.